
After the first article on the Burn Down Chart was published, the second question asked in the comments was: "It's not clear how all these values are calculated." Therefore, in this article I will try to explain how we calculate the daily values on the Burn Down Chart. As usual, I welcome any comments from colleagues if I say something wrong, but still hope that the topic is sufficiently clear.
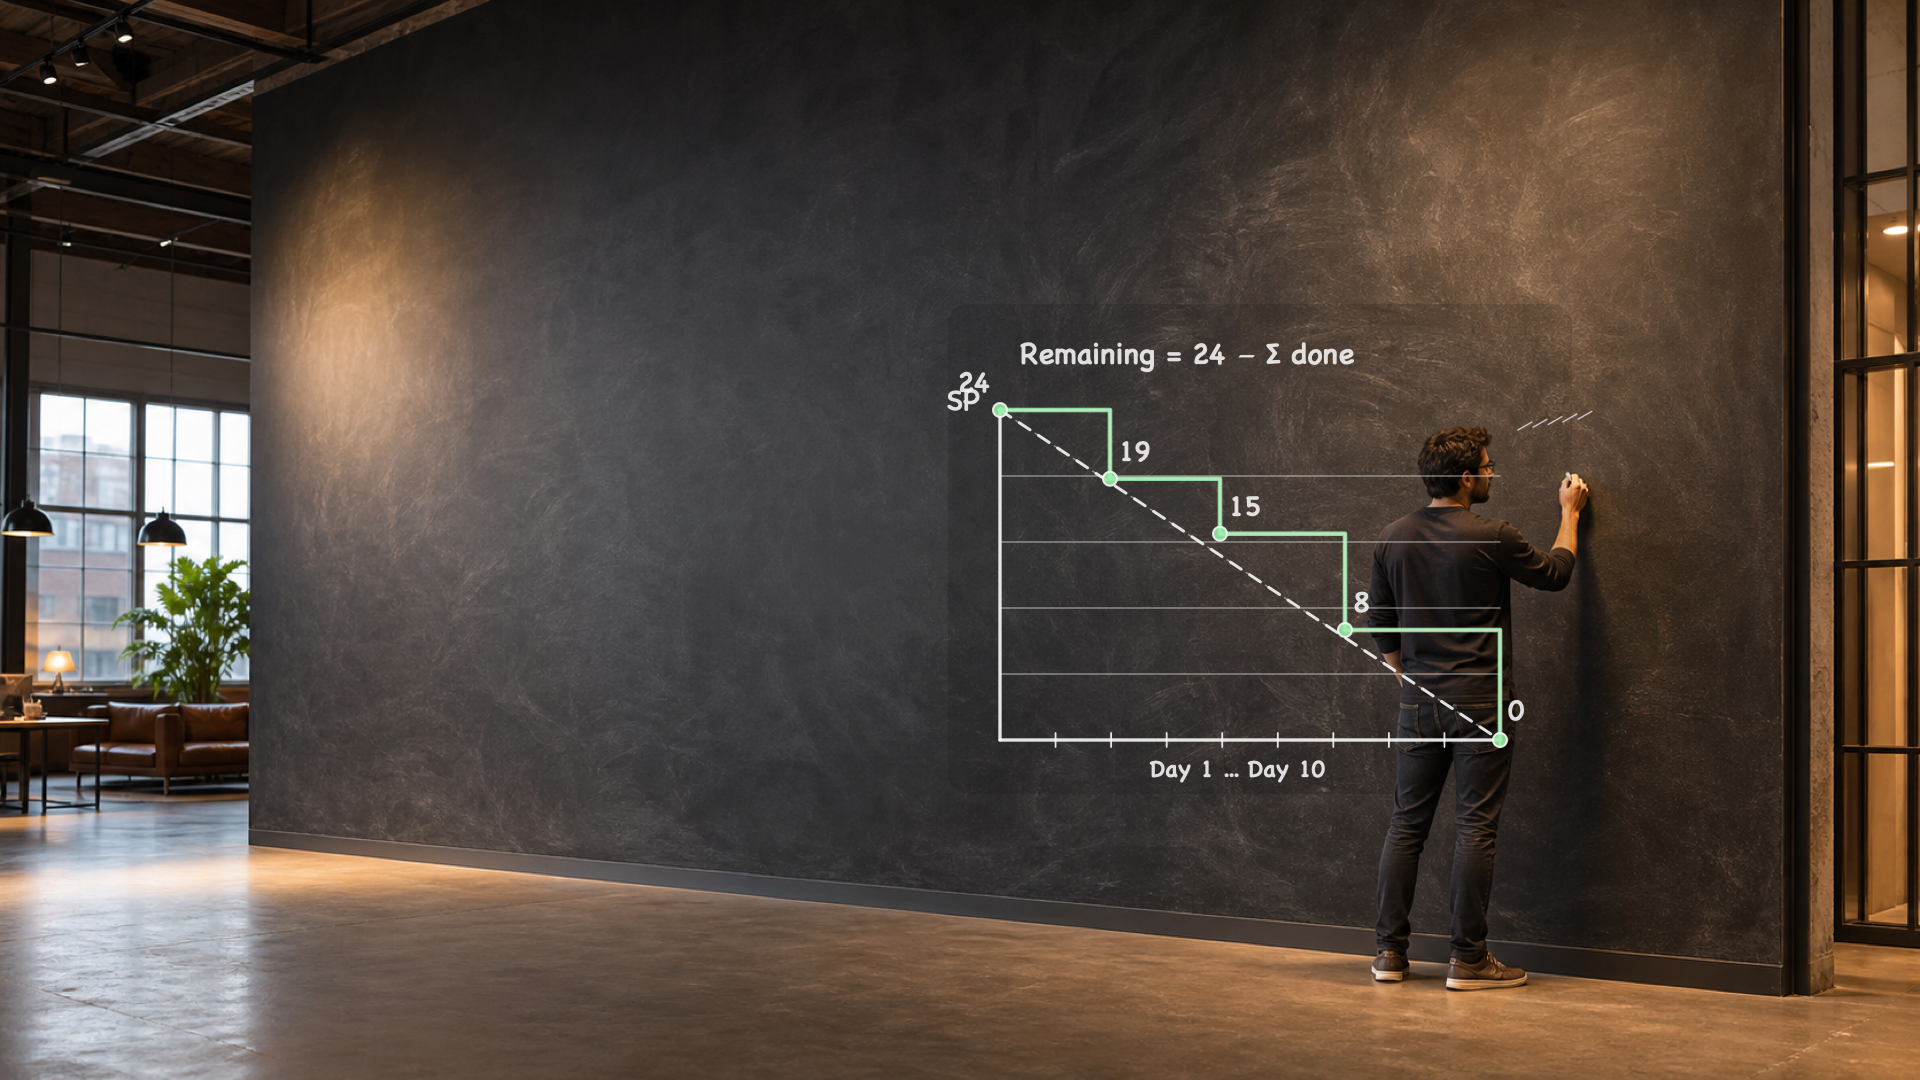
Let's recall once again what this diagram looks like.

In this example, a 10-day sprint is illustrated. We can see that 2 days have passed (since only the first 2 segments are shaded green on the chart).
We also see the total sprint scope – it is the dashed line that shows that the total sprint scope at 10:00 on Monday, 10:00 on Tuesday, and 10:00 on Wednesday remained unchanged and is equal to 17 SP (Story Points).
According to Scrum methodology, the total workload in a sprint does not change during the sprint, so this line is often drawn for the entire sprint (all 10 days). It also helps to visualize how much remains to be done more clearly than if it were to end on the third day as in the current example.
Actual Burn (the green line) shows the actual remaining work. That is, the team has currently completed 1 Story Point out of the 17 required to successfully complete the sprint. A task is usually considered done when it is in the "Done" status (what "Done" means for each team is defined by the team itself. There is even a special artifact called the Definition of Done (DOD), which is unique to each team and precisely describes what it means for a task to be completed and moved to the "Done" status. Most often this means "deployed to production", but there can be nuances.) In general, from the current chart we understand that only one story, which the team estimated at 1 SP, has its DOD completed.
Ideal Burn shows the point where the actual burn-down chart should be if work were done at a perfectly uniform pace. That is, at this moment, 3 SP should have been completed with perfectly uniform work.
I suspect it might be interesting to understand what a Story Point is. In essence, 1 SP for one team and 1 SP for another team can represent different amounts of work. For example, we have teams with the same number of people, but one team has a sprint capacity of 17 SP, and another 35 SP. And that is fine. The point is that each team chooses a reference task against which it estimates all tasks during grooming (the old name - it's a weekly meeting where the PO brings User Stories for estimation and the team estimates them using planning poker) (in SAFe this is called PBR - Product Backlog Refinement).
Thus, we can have a reference User Story: "As a car driver, I want to receive a printed receipt after refueling if necessary." We agree that for our team this is 8 SP. And when the PO presents a new User Story that we need to estimate, we evaluate it relative to this reference task. Accordingly, the new story can be estimated by the team at, say, 5 SP, and so on – each backlog story receives its own estimate.
Team capacity is calculated based on statistics. In the first 1–2 sprints, the number of SP that the team completes is measured and an average value is calculated. Planning is then done based on this value (when the PO fills the sprint with tasks from the backlog up to a certain capacity).
I hope I have explained clearly enough how the values on the Burn Down Chart are calculated.